⏱️ Estimated Read Time – 6–8 minutes
Active Directory replication issues are one of the most common hidden causes of outages, authentication failures, and inconsistent policies in enterprise environments.
Yet most tools used today:
- Are command-line heavy
- Provide only point-in-time visibility
- Are hard to interpret quickly
👉 That’s exactly why I built this:
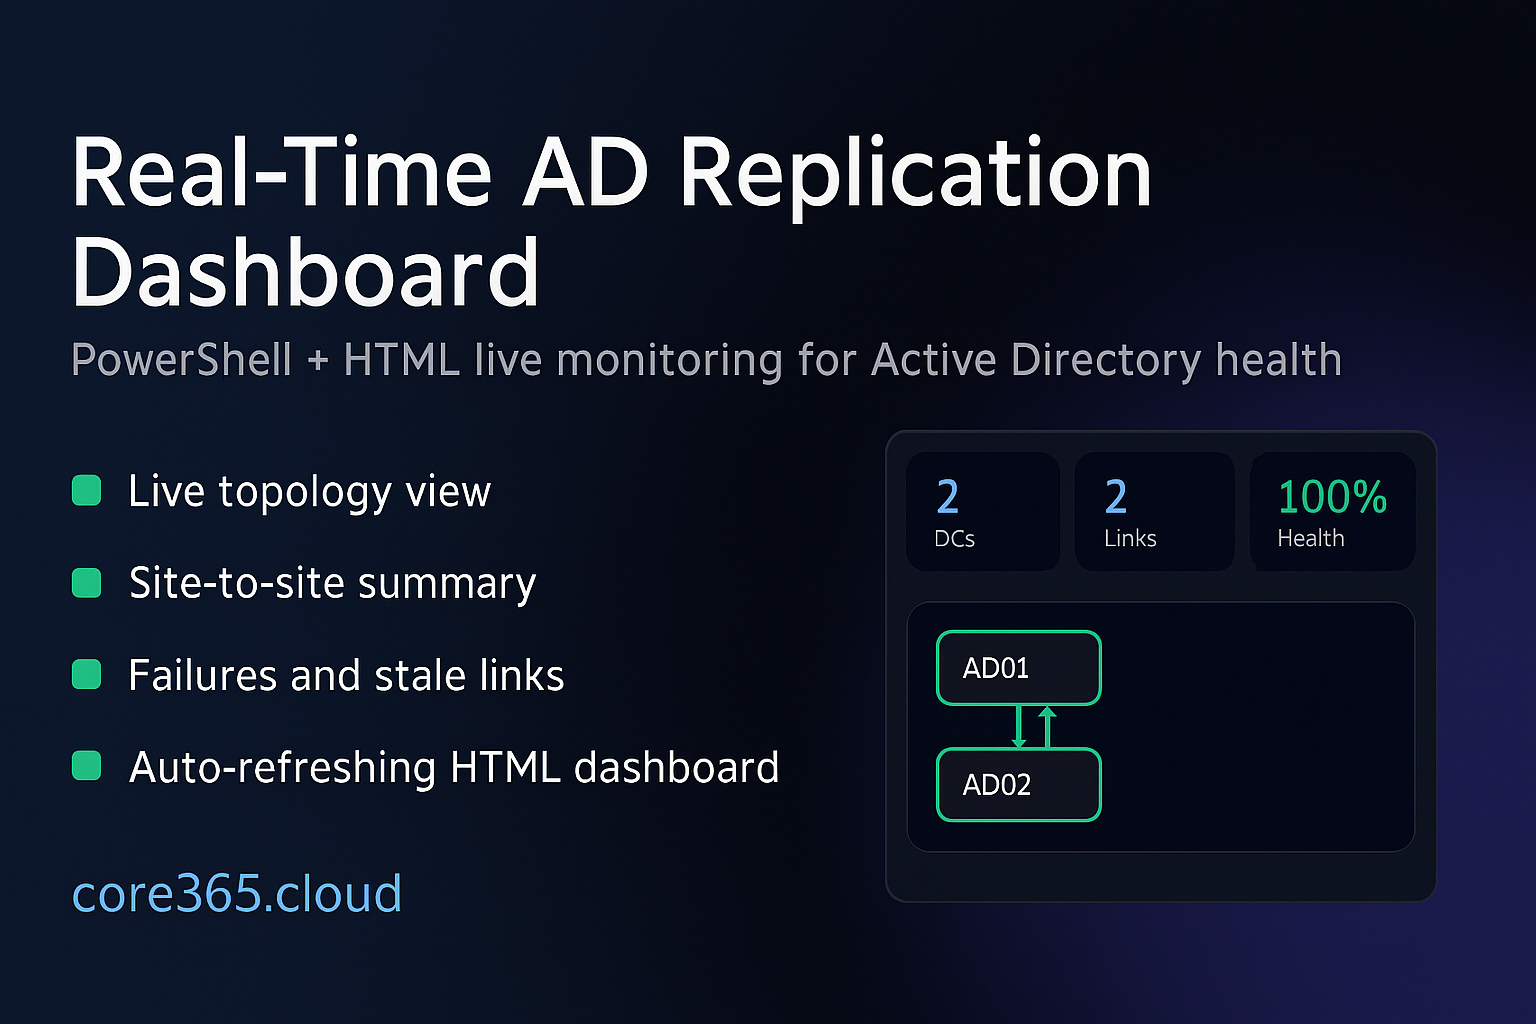
A real-time AD Replication Dashboard powered by PowerShell + HTML that transforms raw replication data into a live, visual, actionable interface.
🔍 What This Script Actually Does
This solution automatically:
- Discovers all Domain Controllers
- Collects replication metadata using:
Get-ADReplicationPartnerMetadatarepadmin /replsummary
- Evaluates replication health (Healthy, Stale, Failed)
- Generates a modern HTML dashboard
- Continuously updates in real-time (live mode)
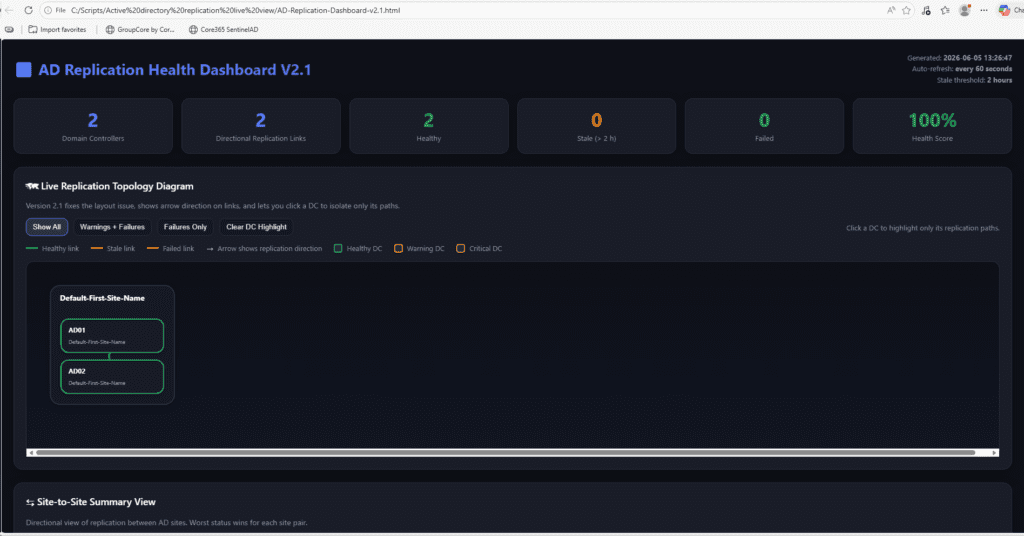
📊 Key Features (Why This Is Powerful)
✅ 1. Live Topology Visualization
- Domain Controllers grouped by AD site
- Replication paths shown with directional arrows
- Color-coded health:
- 🟢 Healthy
- 🟠 Stale
- 🔴 Failed
✅ 2. Real-Time Monitoring
- Auto-refresh every X seconds (default: 60)
- Dashboard updates continuously while script runs
✅ 3. Failure Detection (Instant Visibility)
- Highlights failures and stale links instantly
- Shows:
- Result codes
- Last replication success
- Consecutive failures
✅ 4. Domain Controller Health Summary
Each DC is automatically classified:
- Critical → replication failures
- Warning → stale replication
- Healthy → all good
✅ 5. Smart Handling of Unreachable DCs
- Clearly marked as UNREACHABLE (red indicators)
- Avoids misleading “false healthy” states
✅ 6. Deep Drill-Down Data
Includes:
- Site-to-site replication summary
- Full replication table
- Raw
repadminoutput
🎯 Who Should Use This?
This tool is perfect for:
👨💻 Infrastructure Engineers
- Monitor AD health proactively
- Validate replication after changes
🛠️ System Administrators
- Troubleshoot replication issues faster
- Reduce time spent on CLI tools
🏢 Enterprise IT Teams
- Visual dashboard for operations
- Share with teams via web/IIS
🔐 Security Teams
- Detect replication inconsistencies
- Support audit and compliance
⚙️ Requirements
Before running:
- PowerShell 5.1 or 7+
- ActiveDirectory module installed
repadminavailable- Permissions to query all DCs
🧑💻 How to Use the Script
▶️ 1. Run in Live Mode (Recommended)
.\AD-Replication-Dashboard-v2.1.1.ps1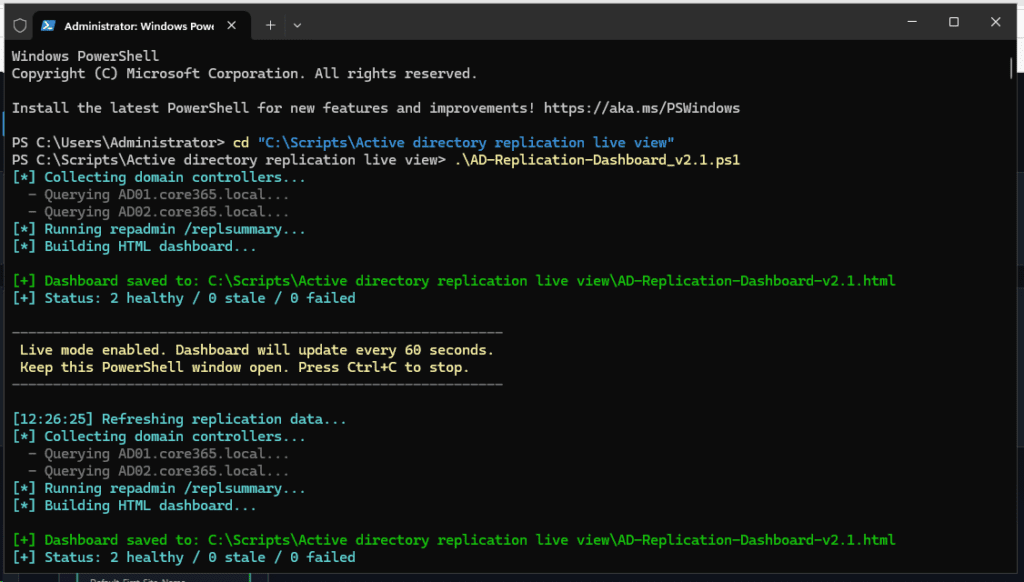
✔ Opens dashboard automatically
✔ Refreshes continuously
▶️ 2. Run Once
.\AD-Replication-Dashboard-v2.1.1.ps1 -RunOnce▶️ 3. Custom Settings
.\AD-Replication-Dashboard-v2.1.1.ps1 -AutoRefreshSeconds 120 -StaleThresholdHours 4▶️ 4. Output to Shared Location
.\AD-Replication-Dashboard-v2.1.1.ps1 -OutputPath "\\Server\Dashboards\AD-Repl.html"✔ Allows team-wide access
💡 Why You Should Use This (Real Value)
Traditional tools:
repadmindcdiag
👉 They are:
- Text-based
- Hard to visualize
- Time-consuming
✅ This solution provides:
- Visual clarity
- Real-time monitoring
- Faster troubleshooting
- Better collaboration
🌐 How to Make This Accessible to Your Team
Option 1 – Shared Folder
- Output HTML to network share
- Open via UNC path
Option 2 – Internal Web Server (Best Practice)
- Use IIS
- Publish dashboard as a URL
✔ Users can monitor from anywhere
✔ Dashboard auto-updates
🔥 Pro Tips for Production Use
- Run script on a management server
- Schedule via Task Scheduler + loop mode
- Publish via internal web portal
An AD replication dashboard in PowerShell is a script-based monitoring solution that collects Active Directory replication data, checks replication health, and presents the results in a visual dashboard. This script uses PowerShell and HTML to show domain controller health, replication paths, failures, stale links, and site-to-site status in real time
The script discovers all domain controllers, gathers replication partner metadata, runs repadmin /replsummary, evaluates each replication link, and then generates a live HTML dashboard. In live mode, it refreshes the dashboard automatically at a configured interval.
The dashboard shows KPI summary cards, a live topology diagram grouped by AD site, directional replication arrows, site-to-site replication summaries, failures and warnings, domain controller health status, a detailed replication table, and raw repadmin /replsummary output.
Yes. The script classifies each replication link as Healthy, STALE, or FAILED. A link is marked as failed when the last replication result is not successful, and it is marked as stale when the last successful replication is older than the configured threshold
This script is useful for Active Directory administrators, infrastructure engineers, operations teams, consultants, and managed service providers who need a clearer and faster way to monitor replication health across domain controllers and sites.
Yes. You can run the script once by using the -RunOnce switch. Without that switch, the script stays in live mode and continues rewriting the HTML dashboard at the configured refresh interval.
Yes. The HTML output can be saved to a shared folder or an internal web server such as IIS. Other users can then open the dashboard from another computer, as long as the script continues updating the HTML file.
If a domain controller cannot be queried, the script adds a synthetic failed entry and marks the DC as unreachable in the dashboard. This makes DC-level collection failures visible instead of allowing them to appear healthy by mistake.
You need Windows PowerShell 5.1 or PowerShell 7+, the ActiveDirectory PowerShell module, repadmin, and an account with permission to query replication metadata from the target domain controllers.
A visual AD replication dashboard makes it easier to identify failures, stale links, unhealthy domain controllers, and site-to-site replication issues quickly. It turns command-line replication data into a format that is easier to understand, share, and troubleshoot.