
If you’ve ever troubleshot a Windows machine, you already know the pain.
You start in Application logs, then jump to System logs.
Then suddenly you need Group Policy logs buried under:
Microsoft → Windows → GroupPolicy → Operational
You export one log…
Then realize you need another…
Then go back again…
Before you know it, you’re stuck in the old Event Viewer UI, clicking endlessly.
👉 This is exactly the problem Core365 Event Dashboard solves.
⚡ What Is Core365 Event Dashboard?
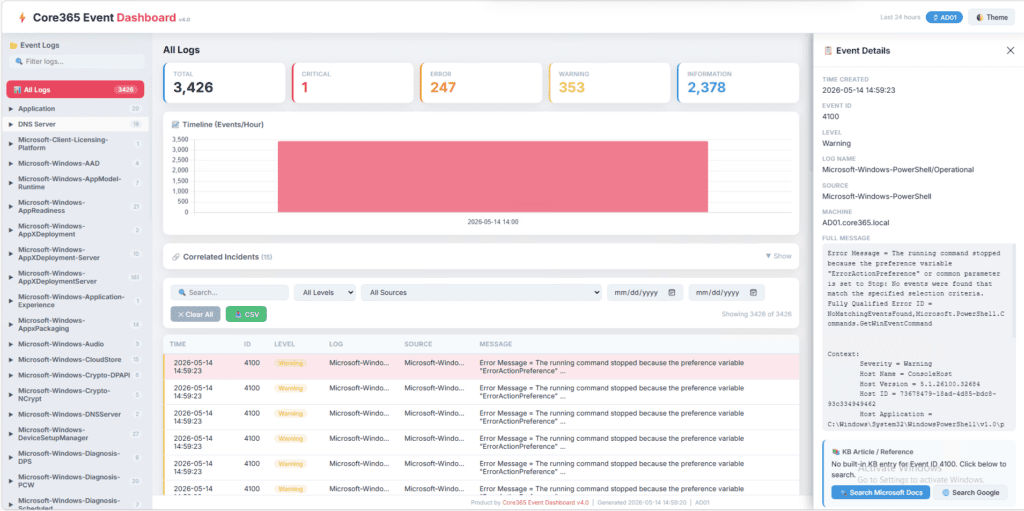
Core365 Event Dashboard is a PowerShell-based event log collector and HTML dashboard generator that:
- Discovers ALL Windows event logs automatically
- Collects events across logs in one run
- Generates a fully interactive HTML report
- Works with zero dependencies — no agents, no servers
You simply run one script and get a complete troubleshooting dashboard instantly.
🧠 Why This Tool Is a Game Changer
Instead of manually collecting logs one by one:
✅ One execution → All logs
✅ One file → Full analysis
✅ One dashboard → Everything linked
The script uses:
Get-WinEvent -ListLog *to discover every log with events, including:
- Group Policy
- PowerShell
- DNS
- Firewall
- NTFS
- Task Scheduler
🖥️ The Dashboard Experience (3-Pane Design)
The generated HTML dashboard is built like a modern SIEM-lite interface:
📂 Left Pane – Log Explorer
- All logs grouped and collapsible
- Search and filter logs instantly
- Event counts per log
📊 Middle Pane – Insights & Analysis
- Summary cards (Total, Error, Warning, etc.)
- Timeline chart (events per hour)
- Correlated incidents
- Advanced filters
- Paginated event table
📋 Right Pane – Deep Dive
- Click any event → see full details instantly
- Includes message, source, machine, and metadata
👉 This 3-pane layout provides fast navigation and deep visibility
🔗 Built-In Event Correlation (This Is Huge)
Instead of manually connecting events, the tool automatically detects incidents.
✅ 7 Correlation Rules Included
| 🔗 Rule | 🧾 Event IDs | 📂 Source | ⏱ Window |
|---|---|---|---|
| 🔐 Account Lockout Chain | 4625 → 4740 → 4767 | Security | 30 min |
| 🚫 Authentication Failures | 4625 4771 4776 | Security | 15 min |
| ⚙️ Service Crash & Recovery | 7034 7036 7040 | System | 60 min |
| 📜 Group Policy Processing | 1500–1503 8000–8007 | GPO | 10 min |
| 🔄 Windows Update | 19 20 21 22 43 44 | System | 120 min |
| 💽 Disk Errors | 7 9 11 15 51 | System | 60 min |
| 🔥 Firewall Changes | 2004 2005 2006 2033 | Firewall | 30 min |
✅ Automatically grouped within time windows
✅ Displayed as “incidents” with severity
No more guessing relationships between logs.
📚 Built-In Knowledge Base (55 Event IDs)
Each event includes:
- Plain English explanation
- What to check next
- Direct Microsoft Docs link
- Fallback Google search
Example:
- 4625 → Failed logon
- 7034 → Service crash
- 41 → Unexpected reboot
- 1102 → Audit log cleared (critical)
👉 This turns the tool into a learning + troubleshooting platform
🔍 Powerful Filtering & Search
You can filter events by:
- Level (Critical / Error / Warning / Info)
- Source
- Date range
- Full-text search
All filters work together using AND logic.
👉 No more scrolling through thousands of events blindly.
📊 Features That Sysadmins Will Love
- ✅ Timeline visualization (events per hour)
- ✅ CSV export of filtered data
- ✅ Sortable event table
- ✅ Pagination (50 per page)
- ✅ Dark/Light mode toggle
- ✅ Instant event detail panel
- ✅ Keyboard support (Escape closes panel)
All packed into a single HTML file you can share anywhere
⚙️ How It Works (Technical Breakdown)
Step 1: Discover Logs
Get-WinEvent -ListLog *Step 2: Collect Events
- Filters by time (
-Hours) - Limits events (
-MaxEventsPerLog) - Normalizes levels & messages
Step 3: Convert to JSON
Each event becomes:
- TimeCreated
- Event ID
- Level
- LogName
- Source
- Message
Step 4: Build HTML Dashboard
- Embeds data into JavaScript
- Uses Chart.js for visualization
- Fully self-contained output
👉 The result: a portable forensic report
🚀 Quick Usage
Set-ExecutionPolicy -Scope Process -ExecutionPolicy Bypass

# Basic run (last 24 hours)
.\EventDashboard_v2.ps1

# Custom example
.\EventDashboard_v2.ps1 -Hours 72 -MaxEventsPerLog 2000
✅ Automatically opens in browser
✅ Generates timestamped HTML report
- Fully self-contained
- Can be emailed or archived
- No installation required
🔐 Security Notes
- Read-only (no changes to system)
- No data leaves the machine
- HTML file contains sensitive logs → handle carefully
🔗 Download & Demo Snippets
✅ Download Script (GitHub)
Download Core365 Event Dashboard Script✅ View Sample HTML Report
View Interactive Event Dashboard Demo🎯 Real-World Use Cases
✅ GPO troubleshooting
✅ Login/lockout investigations
✅ Server crash analysis
✅ Disk and hardware issues
✅ Patch/Windows Update failures
✅ Security auditing
💬 FAQ
No installation required. The script runs directly using PowerShell, which is already built into Windows.
Yes. The script supports Windows Server 2016 and above, making it ideal for both servers and desktops.
Yes, but you must run PowerShell as Administrator to access Security logs.
Absolutely. The output is a single HTML file that you can email or store for later analysis.
For troubleshooting workflows — yes. It provides a much faster and more user-friendly experience than traditional Event Viewer.
🔥 Final Thoughts
Core365 Event Dashboard turns:
❌ Manual log hunting
👉 into
✅ Automated, visual troubleshooting
Instead of jumping between logs and tools, you now get:
- Everything collected
- Everything correlated
- Everything explained
👉 All in one clean dashboard.
👉 Call to Action
If you’re tired of switching between Event Viewer logs:
✅ Try it
✅ Share it with your team
✅ Drop your feedback below

Antonio Rennvick is an IT Infrastructure Manager with 15+ years running enterprise Active Directory, Microsoft 365, and Azure environments. He’s Microsoft certified (AZ-104, MS-102) and writes Core365 Cloud to share what actually works in production—PowerShell automation, AD deep dives, and security hardening drawn from real-world work, not test labs.